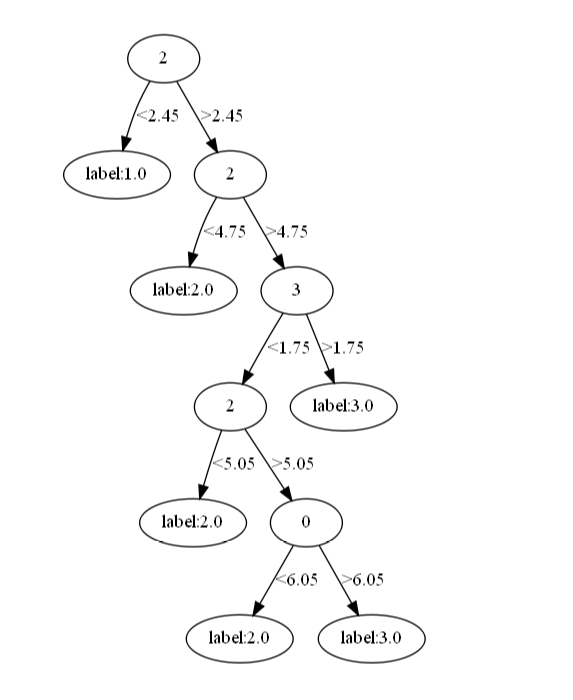
1
2
3
4
5
6
7
8
9
10
11
12
13
14
15
16
17
18
19
20
21
22
23
24
25
26
27
28
29
30
31
32
33
34
35
36
37
38
39
40
41
42
43
44
45
46
47
48
49
50
51
52
53
54
55
56
57
58
59
60
61
62
63
64
65
66
67
68
69
70
71
72
73
74
75
76
77
78
79
80
81
82
83
84
85
86
87
88
89
90
91
92
93
94
95
96
97
98
99
100
101
102
103
104
105
106
107
108
109
110
111
112
113
114
115
116
117
118
119
120
121
122
123
124
125
126
127
128
129
130
131
132
133
134
135
136
137
138
139
140
141
142
143
144
145
146
| import numpy as np
from collections import Counter
from graphviz import Digraph
import os
os.environ["PATH"] += os.pathsep + 'D:/Graphviz2.39/bin'
def loadData(filename):
with open(filename) as f:
line = f.readline()
res = []
while line:
c = line.split()
content = [float(x) for x in c]
res.append(content)
line = f.readline()
return res
def getEnt(data):
num = len(data)
labelCount = {}
for feature in data:
label = feature[-1]
if label not in labelCount.keys():
labelCount[label] = 0
labelCount[label] += 1
Ent = 0
for key, p in labelCount.items():
p = p / num
Ent -= p*np.log2(p)
return Ent
def splitDate(data,feature,point):
data1 = [x for x in data if x[feature]<point]
data2 = [x for x in data if x[feature]>point]
return data1,data2
def chooseBF(data):
featureValue = []
num = len(data)
Ent = getEnt(data)
numFeature = len(data[0])-1
maxGain = float('-inf')
for i in range(numFeature):
featureList = [feature[i] for feature in data]
featureList = sorted(list(set(featureList)))
for j in range(len(featureList)-1):
data1,data2 = splitDate(data,i,(featureList[j]+featureList[j+1])/2)
Ent1 = getEnt(data1)
Ent2 = getEnt(data2)
Gain = Ent - (len(data1)/num)*Ent1 - (len(data2)/num)*Ent2
if Gain>maxGain:
feature = i
point = (featureList[j]+featureList[j+1])/2
dataLeft = data1
dataRight = data2
maxGain = Gain
return feature,point,dataLeft,dataRight
def creatTree(data):
node = {}
label = [sample[-1] for sample in data]
if len(set(label))==1:
node['label'] = label[0]
return node
unique = []
for i in range(len(data[0])-1):
unique.append(len(set([sample[i] for sample in data])))
tot = sum([1 for x in unique if (x == 1)])
dataCount = Counter([sample[-1] for sample in data])
if (tot == 4):
node['label'] = list(dataCount.most_common(1)[0])[0]
return node
featureIndex,point,dataLeft,dataRight = chooseBF(data)
node['value'] = point
node['feature'] = featureIndex
node['leftChild'] = creatTree(dataLeft)
node['rightChild'] = creatTree(dataRight)
return node
def predict(sample,node):
if 'feature' in node:
if sample[node['feature']]>node['value']:
label = predict(sample,node['rightChild'])
else:
label = predict(sample,node['leftChild'])
else:
return node['label']
return label
def test(data,tree):
num = len(data)
ans = []
for i in range(num):
ans.append(predict(data[i],tree))
return ans
def plot_model(tree, name):
g = Digraph("G", filename=name, format='png', strict=False)
g.node("0", str(tree['feature']))
_sub_plot(g, tree, "0")
return g
g.view()
root = "0"
def _sub_plot(g, tree, inc):
global root
ts = tree
for i in ts.keys():
if i == 'leftChild':
root = str(int(root) + 1)
if 'feature' in tree[i]:
g.node(root,str(tree[i]['feature']))
else:
g.node(root, str(tree[i]['label']))
g.edge(inc, root, '<' + str(tree['value']))
_sub_plot(g, tree[i], root)
if i == 'rightChild':
root = str(int(root) + 1)
if 'feature' in tree[i]:
g.node(root, str(tree[i]['feature']))
else:
g.node(root, str(tree[i]['label']))
g.edge(inc, root, '>' + str(tree['value']))
_sub_plot(g, tree[i], root)
if i == 'label':
g.node(root, 'label:' + str(tree['label']))
if __name__ == '__main__':
trainData = loadData('traindata.txt')
testData = loadData('testdata.txt')
tree = creatTree(trainData)
ans = test(testData,tree)
trueLabel = [sample[-1] for sample in testData]
rightCount = 0
for i in range(len(ans)):
if ans[i]==trueLabel[i]:
rightCount = rightCount + 1
g = plot_model(tree, "决策树")
g.view()
print(rightCount/len(ans))
|
